From: Poland
Location: Kraków, PL
On Useme since 11 October 2018
As a specialist trained in data science, statistics, and psychology, I have acquired extensive experience working with vast and diverse data sets, employing advanced analysis methods. Data analysis has been my thing for the past 7 years, and I’ve had the opportunity to collaborate with many researchers and institutions in this field. Additionally, I leverage my expertise and knowledge to teach statistics to psychology students.
I am open to collaboration in statistical data analysis, data manipulation and cleaning, data visualization, and statistical/machine learning model development.
Oct 2020 - Now
Pedagogical University of Cracow
Teaching and advising students (mostly statistics classes), Conducting and contributing in scientific research, Statistical analysis of data (with SPSS, R, Python and Matlab, including psychophysiological data).
Jan 2020 - Sep 2020
CBR Rock Master
Design and conduct of quantitative (including psychophysiological) and qualitative research, Statistical analysis of ongoing research (with R and Python), Creating and psychometric development (EFA, IRT) of a questionnaires.
Jun 2019 - Now
Self-Employment
Statistical analyses for master’s theses (with R, jamovi and Python), Statistical analyses for doctoral theses (mostly in R and Python), Statistical consultation in scientific research, Methodological consultations in quantitative research.
 Analysis of reviews for Ghostrunner.
VADER Sentiment analysis of Ghostrunner reviews on Opencritic (Python).

VADER Sentiment analysis of Ghostrunner reviews on Opencritic (Python).
 Where are the Dundies? Face recognition in Python.
Faces Recognition in python with OpenCV and face_recognition package.

Faces Recognition in python with OpenCV and face_recognition package.
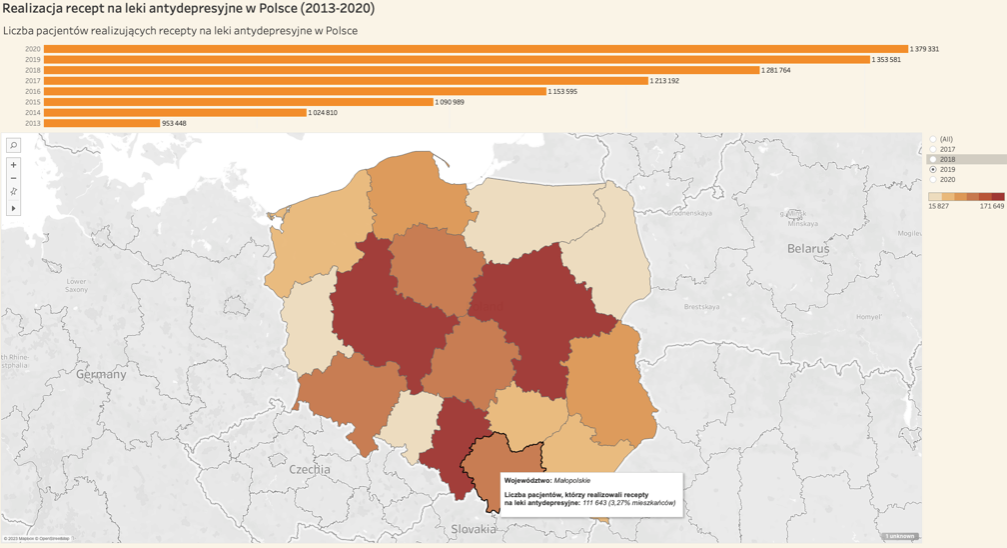
 Prevalence of antidepressants in Poland.
Dashboard made in Tableau, showing the prevalence of antidepressants in Poland, from 2013 to 2020.

Dashboard made in Tableau, showing the prevalence of antidepressants in Poland, from 2013 to 2020.
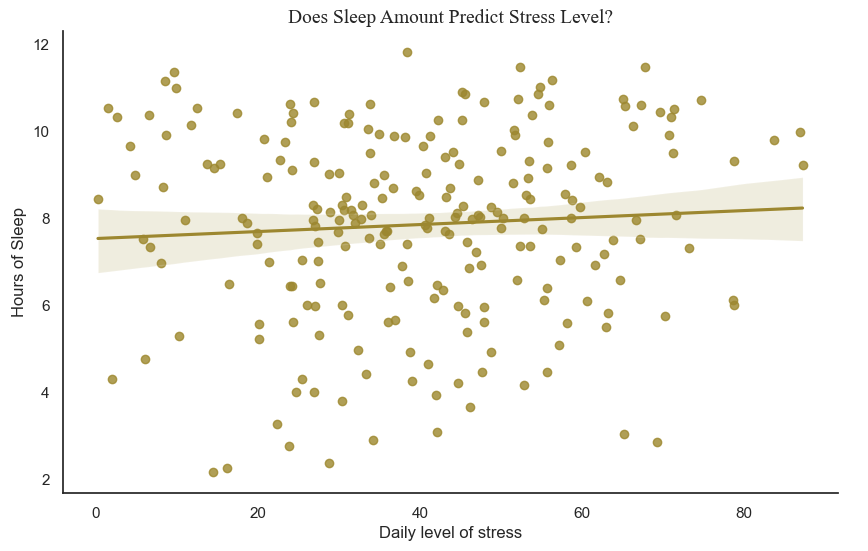
 Does Sleep Amount Predict Stress Level?
Simple Linear Regression Model on data from Galaxy Watch4 (Python).

Simple Linear Regression Model on data from Galaxy Watch4 (Python).
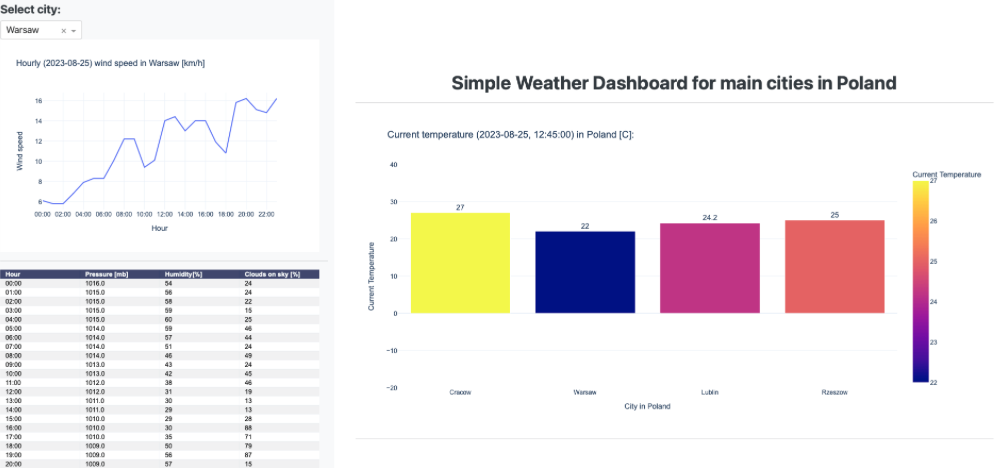
 Weather in main cities in Poland.
This is a sample dashboard made in Plotly Dash (Python), showing the actual temperature, hourly wind speed, pressure, humidity and cloudiness percentage in main cities in Poland (Cracow, Warsaw, Lublin, Rzeszow).

This is a sample dashboard made in Plotly Dash (Python), showing the actual temperature, hourly wind speed, pressure, humidity and cloudiness percentage in main cities in Poland (Cracow, Warsaw, Lublin, Rzeszow).